Axis Civitas
Introduction & Purpose | Objectives | Project Program | Site | Jury | Resources | Awards
Winning Entries
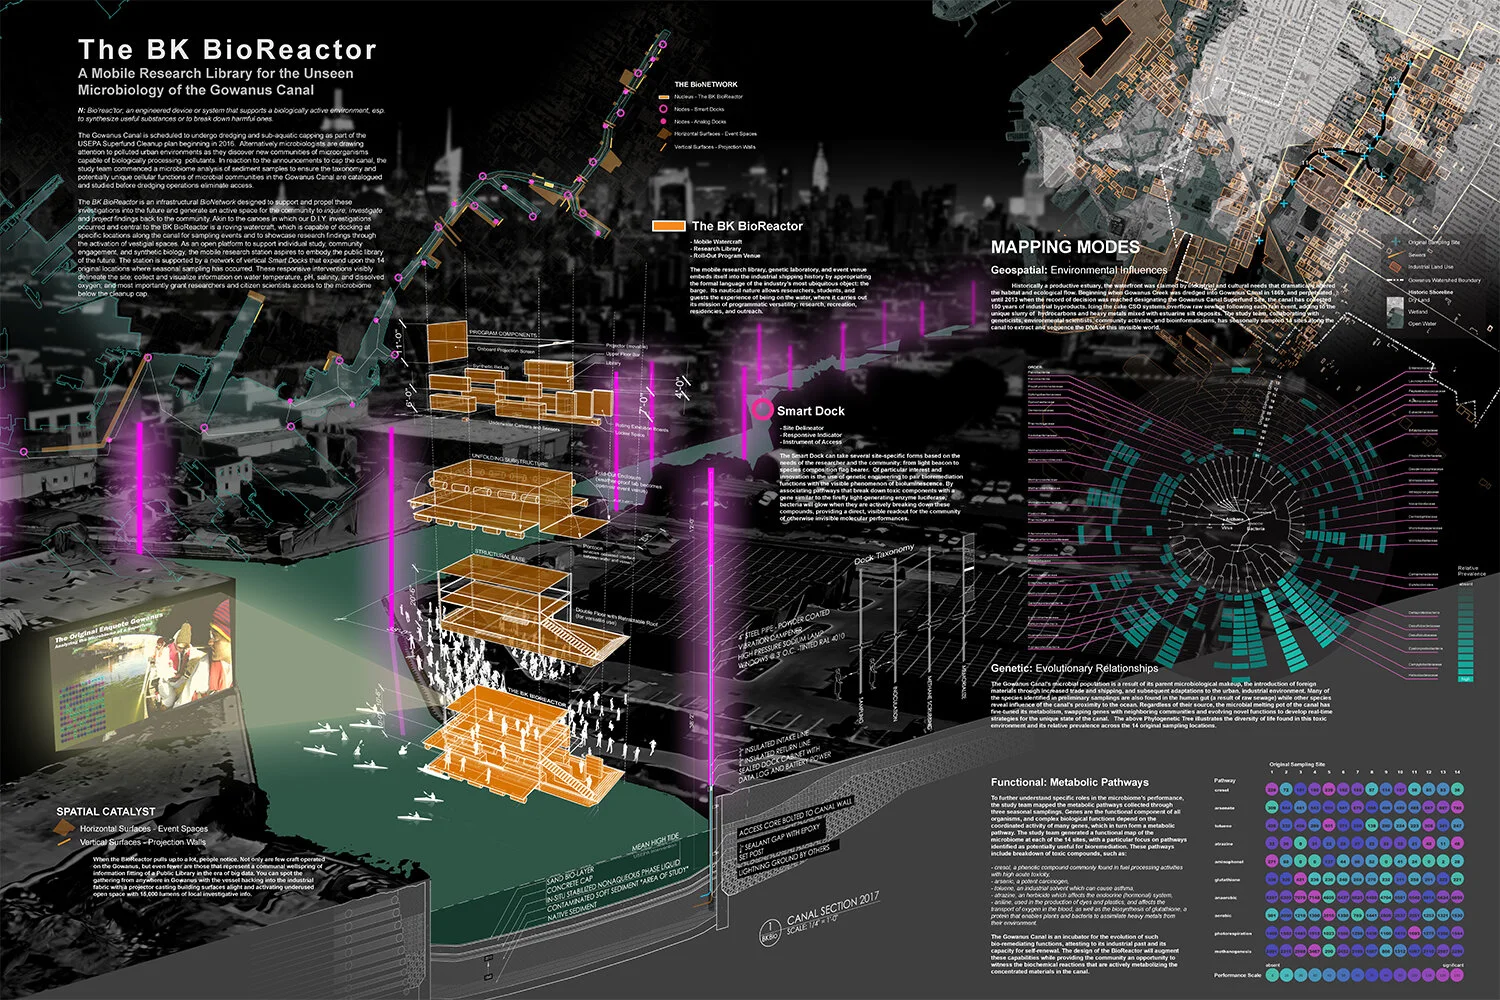
The BK BioReactor
1st Prize
Team: Nelson Byrd Woltz Landscape Architects (Matthew Seibert and Ian Quate) and Weill Cornell Medical College (Dr. Elizabeth Henaff)
New York, New York

Live Ends
2nd Prize
Team: Annie Barrett Studio (Annie Barrett, Mariana Mogilevich, Lucas Bucknavage, and Grey Wartinger)
Brooklyn, New York

Zipping The Gowanus - Unity Through Diversity
Honorable Mention
Team: AnAn (Annette Bohr and Anna Lips)
Zurich, Switzerland

Field Station Of The Industrial Sublime
Honorable Mention
Team: OP-AL (Jennifer Birkeland, Jonathan A. Scelsa, Erin Wythoff, Will DiBernardo, and Isaac Stein )
Brooklyn, New York

The Gowanus Urban Field Station
Honorable Mention
Team: Office of Architecture (Aniket Shahane, Ivan Kostic, and Valentin Bansac)
Brooklyn, New York

Who Owns Gowanus?
Honorable Mention
Team: Pilot Projects Design Collective (Scott Francisco, Zeynep Goksel, Daniel Joo, Andrew Renninger, and Max Scoppettone)
New York, New York

Go-Gowanus!
Honorable Mention
Team: Marina Bourderonnet, David Lee, Benjamin Hait, and Kathlyn Kao
New York, New York